

Introduction of the Project
In this machine learning project, we will predict the Percentages of Students using Python. This is a classic supervised machine learning model that predicts student percentages based on the number of hours they are studying or learning. We will implement a linear regression algorithm to predict the percentage corresponding to Python’s “sklearn” module.
Objectives
- To predict the percentage of individuals based on specific characteristics, i.e., the number of hours spent studying.
- Usage of some graphs and scatter plots in Python’s Matplotlib library. This is useful for visual analysis of the data.
- This model helps students complete their lessons on time and analyze their study plans. And accordingly, they can increase the number of study hours to achieve maximum results.
Requirements
The requirements for this machine learning model to predict the Percentages of Students using Python:
- You need to set up Python on your system. And install all the required libraries, such as pandas, matplotlib, etc. (Note: These libraries can be installed on Jupyter notebooks using the “pip command” from the command prompt or directly.)
- Jupyter Notebooks or Google Collab to build machine-learning models.
Source Code
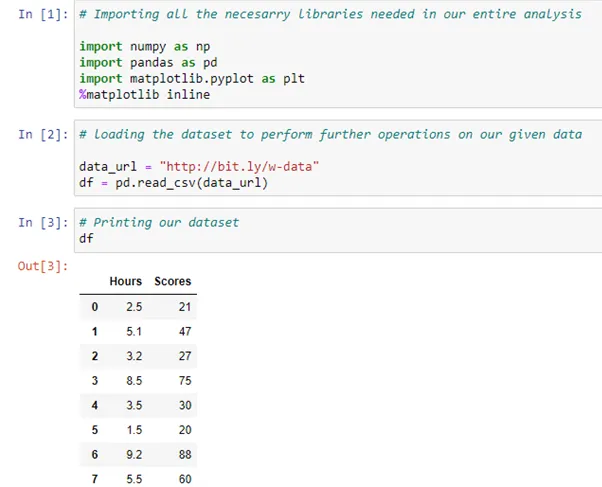
# Importing all the necessary libraries needed in our entire analysis
import numpy as np
import pandas as pd
import matplotlib.pyplot as plt
%matplotlib inline
# loading the dataset to perform further operations on our given data
data_url = "http://bit.ly/w-data"
df = pd.read_csv(data_url)
# Printing our dataset
df
# checking the shape of data set
df.shape # which gives us the result that our dataset contains 25 rows and 2 columns
# Printing the first five observations using head funtion
df.head()
# Printing the last five observations using tail funtion
df.tail()
# Process to check if any missing value is present in our data set or not!
df.isna()
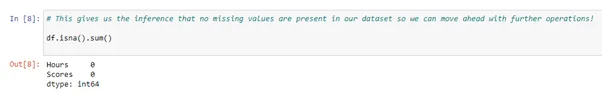
# This gives us the inference that no missing values are present in our dataset so we can move ahead with further operations!
df.isna().sum()
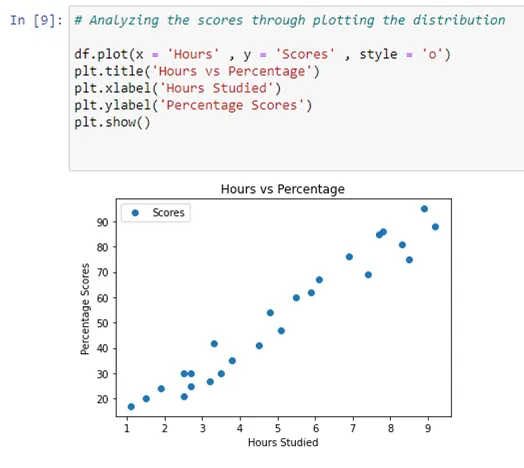
# Analyzing the scores through plotting the distribution
df.plot(x = 'Hours' , y = 'Scores' , style = 'o')
plt.title('Hours vs Percentage')
plt.xlabel('Hours Studied')
plt.ylabel('Percentage Scores')
plt.show()
# Checking the statistical results
df.describe()
# Dividing the data into features(input) and labels(output)
x = df.iloc[:,:-1].values
y = df.iloc[:,1].values
print(x)
print(y)
# Training and test splitting
from sklearn.model_selection import train_test_split
X_train , X_test , y_train , y_test = train_test_split(x , y , test_size = 0.2 , random_state = 0)
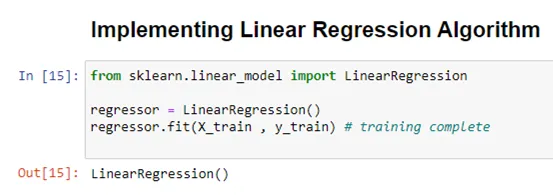
from sklearn.linear_model import LinearRegression
regressor = LinearRegression()
regressor.fit(X_train , y_train) # training complete
# Plotting the regression line
line = regressor.coef_*x+regressor.intercept_
# Plotting for the test data
plt.scatter(x, y)
plt.plot(x, line , color = 'red');
plt.show()
# Testing our Algorithm
print(X_test)
y_pred = regressor.predict(X_test)
# Creating a data frame of actual and predicted values
data_frame = pd.DataFrame({'Actual' : y_test , 'Predicted' : y_pred})
data_frame
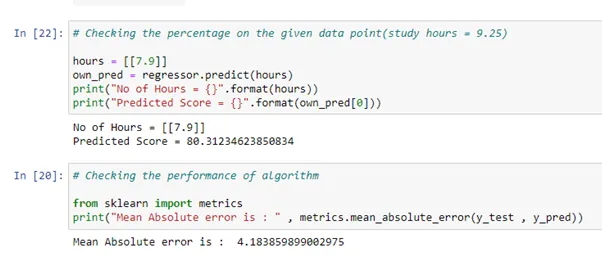
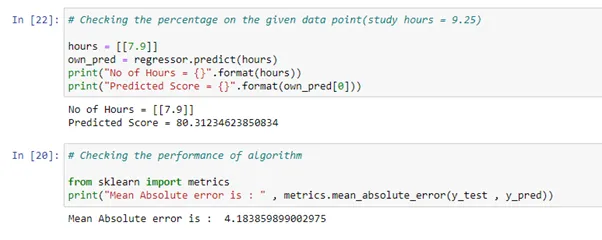
# Checking the percentage on the given data point(study hours = 9.25)
hours = [[7.9]]
own_pred = regressor.predict(hours)
print("No of Hours = {}".format(hours))
print("Predicted Score = {}".format(own_pred[0]))
# Checking the performance of algorithm
from sklearn import metrics
print("Mean Absolute error is : " , metrics.mean_absolute_error(y_test , y_pred))
Explanation of the Code
1. Building a model begins by first loading the dataset, reviewing the dataset, and concluding that the dataset was successfully loaded into the Jupyter notebook. So initially, we imported all the required libraries and loaded the data accordingly using the read_csv function of the “pandas” library.
2. When the dataset is loaded, we check to see if the dataset has null or null values. If it exists in the dataset, you should remove these values and convert the dataset to a clean dataset. Once the dataset is clean, you can use it for the following operations:
3. Next, use matplotlib to create the visualization.
4. Then, the linear regression algorithm is loaded by the sklearn library, and the model is in the training phase.
5. The best fit line of Linear Regression is fitted into our plot, and now it’s time to create a new data frame and predict the percentage of students.
6. To check the accuracy of our model, we use the concept of mean absolute error, which gives the accuracy and lets us know how efficient our model is and how close the predicted values are to the actual values.
Output
On running this machine learning source code successfully, you will get the following output.
Conclusion
Hence we developed a machine learning model to predict the Percentages of Students using Python, which was successfully able to predict the marks of a student on the basis of a given feature, that was, the number of hours of learning. We observed that the model predicted the values close to the actual values resulting in the conclusion that our model is efficient enough to predict the percentage of a student on the basis of the number of hours devoted to his work of study.